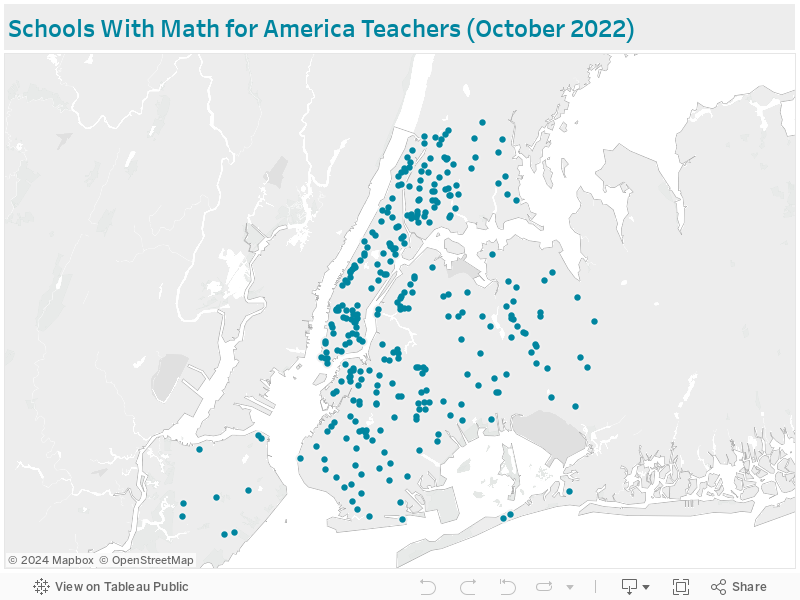
Interactive map of schools in New York City that have Math for America Master Teachers. The map was created using Tableau, Google Sheets and a program for converting addresses into GPS coordinates.
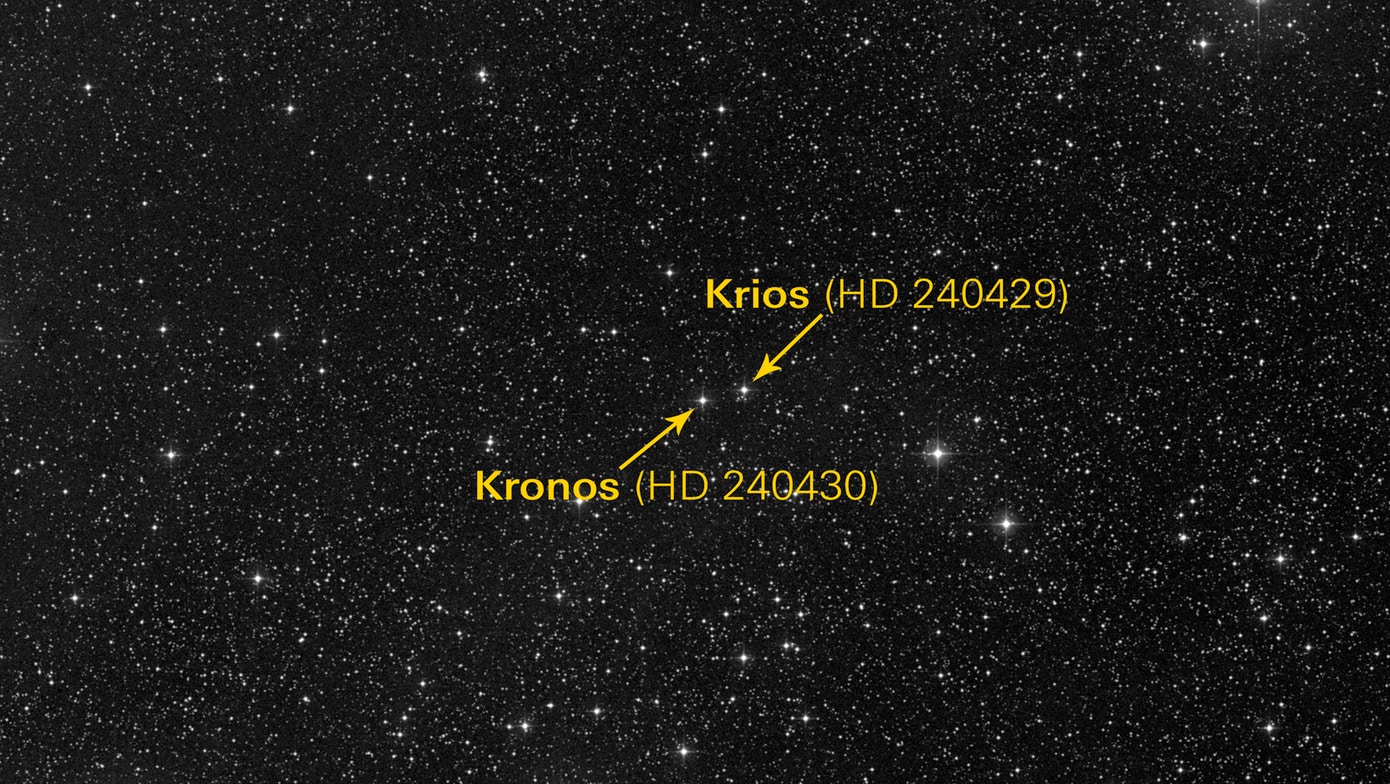
Infographic: Star Map
Simons Foundation, October 2017Graphic showing the location of two stars, Kronos and Krios. The chemical composition of Kronos suggests that the star consumed several of its rocky planets. Made in Photoshop using data from the STScI Digitized Sky Survey.
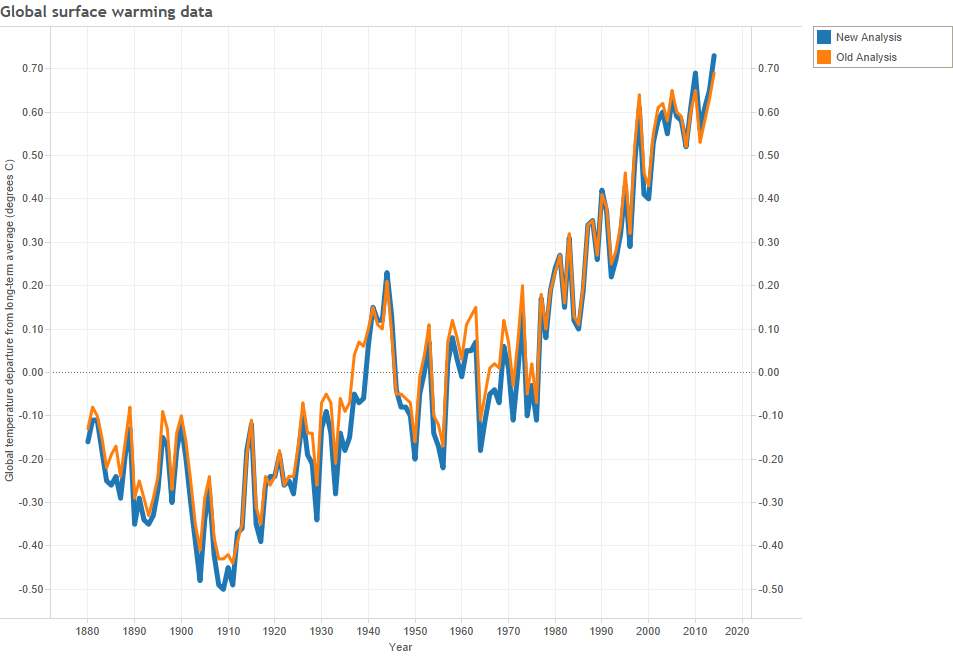
Interactive infographic comparing old and new climate data analyses created by NOAA. The new analyses removed the so-called post-1998 "warming hiatus." Created in Tableau.
Infographic: ScienceWOW Facts
Science, February 2014A human heart pumps enough blood in a lifetime to fill 3 supertankers #sciencewow @sciencemagazine pic.twitter.com/tdOBRyUtqS
— Thomas Sumner (@ThomasSumner) February 13, 2014
The universe is beige #scienceWow #AAASmtg @ScienceNews pic.twitter.com/EG2hw3dtxP
— Thomas Sumner (@ThomasSumner) February 15, 2014
The coldest known spot in the universe is on Earth #scienceWOW #AAASMtg @ScienceNews pic.twitter.com/iWwapj0Lsq
— Thomas Sumner (@ThomasSumner) February 15, 2014
Infographics about cool science facts. Created in Adobe Photoshop.
Podcast about the creation of an iPad game aimed at helping children born with cleft palates improve their speech. Created in Adobe Audition and Audacity.

Infographic: Speech Recognition
Science Notes, August 2013Infographic demonstrating how the speech recognition system works on an iPad game built to help children born with cleft palates improve their speech. Created in Adobe Photoshop.
Video: Peel and Stick Electronics
WhyTV, June 2013Featured on WhyTV. Created in Adobe Premiere.